
What we measure: digital mindset.
In Leapshift, technology is one of the conditions, alongside structure and culture. We measure more than the systems that are in place. We look at what we call the digital mindset: how tech-minded are your people, and does it show? Do they look for a smarter way themselves, or wait until someone brings in a new system?
And we look at whether people can use technology well. An organisation can have everything in-house and still do very little with it. Then an extra licence won’t help.
Together, those two show you where to start: with people who want to but don’t know how, or with people who can but don’t yet see the point.
Starting small often works best.
We worked with a management team that struggled to record its decisions. Discussions wandered off, and afterwards not everyone knew exactly what had been decided. Taking minutes kept getting dropped.
A simple app already helped a lot. With Wispr Flow you speak a decision or action point, and it goes straight into the minutes. With its Notetaker feature, the same app makes a transcript and a summary of the meeting on the Mac. For this team, that felt like real innovation.
There are plenty more solutions like this. They cost little, you can use them tomorrow, and people experience for themselves what technology does for them. We help you choose what fits and make agreements on use and privacy.
Six tools to start with
Dictate instead of typing
Speak a decision or action point, and it goes straight into the minutes or the email. For example with Wispr Flow.
Get meetings transcribed
A transcript and a summary of the meeting, with the decisions at the top. With Wispr Flow’s Notetaker, Copilot in Teams, or the transcription in Google Meet, if your licence includes it.
An AI assistant for the first draft
An agenda, a summary of a long document or a first outline of a memo, with ChatGPT or Copilot. With agreements on what must not go into it.
One action board
Action points on one shared board, such as Planner or Trello, instead of scattered across email.
A quick poll after the meeting
Two questions in Forms: was it useful, and what could be better? After a month you can see whether your meetings are improving.
One automated step
A form that creates a task straight away, with Zapier or the automation in your own software. A first taste of automation, without a project.
Only record and transcribe if everyone at the table knows and agrees, with agreements on where the recording and the minutes are kept.
And when it’s bigger.
Sometimes a tool isn’t enough. Then we look at the application landscape: which systems there are, who uses them and where data gets entered twice. If you understand your landscape, you get more out of what is already there.
And we look at the processes behind it, where automation and AI can take over the manual work. How we go about that is explained below, under process optimisation.
Help, or hindrance.
Technology isn’t progress in itself. A system locks in the way you work, and sometimes that is exactly the way you wanted to change. A new app next to three existing ones can create more work than it saves.
So with every solution we ask two questions. Which problem does this solve, and for whom? And what does it ask of people to use it well? Sometimes the honest answer is that you are better off taking something away than adding something.
Process optimisation
Process optimisation starts with how the work really flows today. You map the process, mark where time is lost to waiting, double entry and rework, design the new process, and only then bring in technology: automation in the system, integrations and AI.
Most of the time, the work is just waiting.
Follow a single request through the organisation and you’ll see it. Fifteen minutes of actual work, and a week and a half in transit. It sits in an inbox, waits for a signature, gets sent back because something was missing, and is retyped into a second system. Nobody is doing anything wrong. Everybody is busy.
Process optimisation means organising the work differently, so it goes faster, with fewer mistakes and less manual work. Which approach fits depends on where it gets stuck.
Lean
When the work mostly sits waiting.
A value stream map makes the waste visible, so you can take out whatever adds no value.
Redesign
When patching it up no longer helps.
Sometimes a process has grown up around a system or an exception that disappeared long ago. Then you start from what the customer needs and design it again.
Automating processes with AI
When the process is sound but still involves manual work.
Forms that are complete at the source, integrations instead of retyping, approvals handled by automation in the system, and AI agents that do the groundwork, such as reading and checking a request.
Continuous improvement
When it has to keep working.
Short cycles of plan, do, check and adjust, with the figures in one fixed place. That way the process keeps improving after we have gone.
Lean and the value stream map
Lean comes from Toyota’s factories, where Taiichi Ohno began naming waste systematically: waiting, unnecessary transport, rework, doing things nobody needs. Womack and Jones made it widely known in 1990 under the name lean production. Holweg describes how it then left the factory and moved into healthcare, government and the office.
The tool we use most is the value stream map, by Mike Rother and John Shook. You draw the process as it runs today, with the time, the waiting time and what goes wrong at each step. Then you mark the waste. After that, you design the process as it could be.
- 1Request by email5 min1 day waiting
- 2Retyping into the system10 minDouble entry3 days waiting
- 3Manager approval2 min
- 4Check8 min1 day waiting
- 5Back to the requester5 minRework2 days waiting
- 6Entering it again8 minDouble entry1 day waiting
- 7Passing it on to the team2 minHandover1 day waiting
- 8Completion5 min
Actual work45 minutes
Lead time9 working days
This request takes 45 minutes of work, but 9 working days from start to finish. It is entered twice and sent back to square one once.
- 1Request via a form5 minComplete at the source
- 2Automatic check0 minAutomation
- 3One-click approval1 minFixed mandateshalf a day waiting
- 4Completion9 min
Actual work15 minuteswas 45 minutes
Lead time1 working daywas 9 working days
From 45 minutes of work to 15, and from 9 working days to one. The system does the check, and who approves what is agreed in advance.
Nobody gets thanked for a fire that never starts.
In 2001, Nelson Repenning and John Sterman of MIT looked into why so many improvement programmes deliver nothing. Under pressure, people choose to work harder: overtime, quick fixes, pushing on. That helps straight away. Improving the process only helps later, and then what you mostly see is problems that no longer occur. Those don’t count in any report, so firefighting wins.
Radnor, Holweg and Waring saw in the English health service what happens when Lean stays stuck at the level of individual tools. Improvement weeks and rapid sessions brought small, local gains. The big improvement never came, because the way the organisation was run and managed didn’t change with it.
The same goes for technology. Erik Brynjolfsson and Lorin Hitt showed that investment in IT mainly pays off when the organisation changes its work along with it. Michael Hammer put it more briefly, in 1990: don’t automate a bad process, first strip out what doesn’t belong in it.
Process first, then technology.
We map the current situation together with the people who do the work. They know where it gets stuck, and they often see it as a whole for the first time. Every bit of waste gets marked: double entry, waiting, rework, handovers.
Then we count. How often does this happen a year, how many minutes of manual work are in it, how often does it have to be redone, and what does a mistake cost if it is only found later? That makes visible what Repenning and Sterman called invisible, and it gives you the business case: fewer mistakes, less manual work, less rework.
Technology only comes in with the new process. A form that is complete at the source, a check the system does, an integration instead of retyping, and where it fits an AI agent that does the groundwork: reading a request, asking for the missing details, preparing a proposal. Half the automation often turns out to be unnecessary once the process is right.
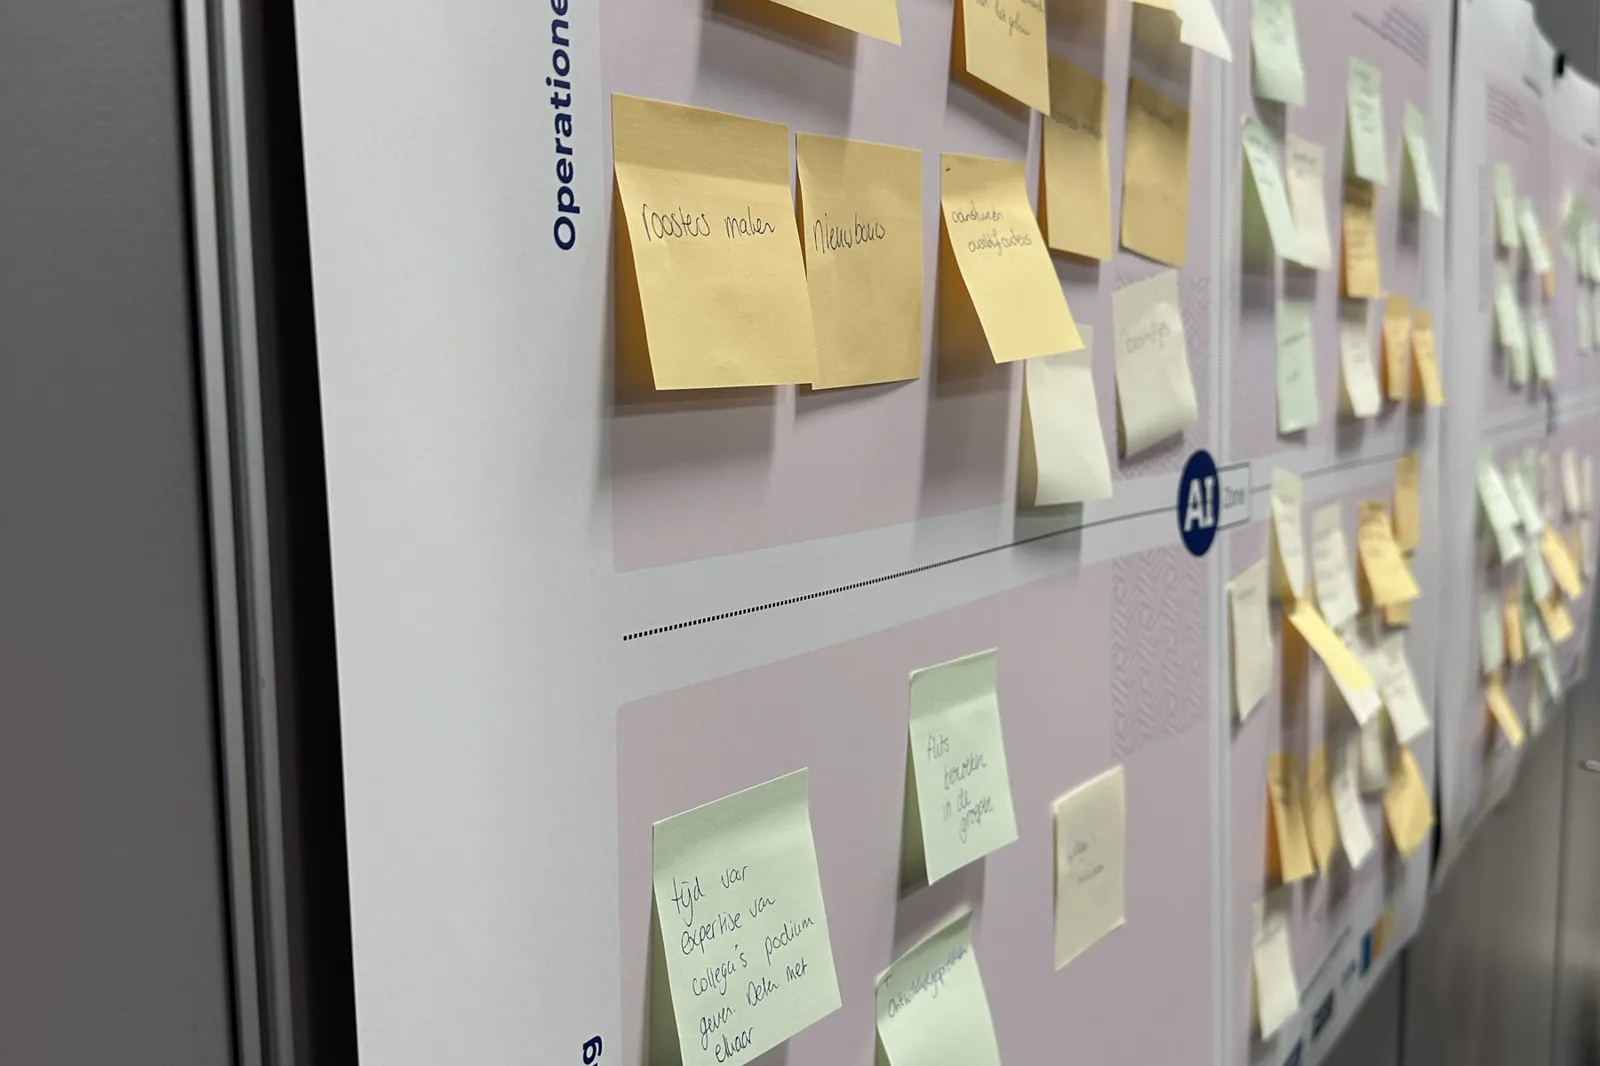
After that, the process keeps moving. With short improvement cycles and the figures in one fixed place, an Obeya wall for example, the team can see for itself where it is starting to pinch again. W. Edwards Deming called it plan, do, check, act.
Questions we often get
Isn’t Lean just for factories?
It comes from Toyota’s car plants, but it works anywhere work passes from hand to hand. In an office the waste is just harder to see: no piles of parts, but a full inbox, a request waiting three days for sign-off, and data that gets entered twice.
What is the difference between a process map and a value stream map?
A process map shows which steps there are. A value stream map also shows how long each step takes, how long the work sits waiting in between and where it goes wrong. That lets you see the difference between the time someone is actually working on something and the total time it takes. That difference is usually large.
How do you build a business case for process improvement?
You count what is invisible today: how often something has to be redone, how many minutes of manual work a request takes, how many requests there are per year and what a mistake costs if it is found later. Multiply, and you see what it is worth. Mistakes that no longer happen won’t show up anywhere later, which is why it matters to count them beforehand.
Can’t you just automate?
Then you just make a detour faster. Michael Hammer said it back in 1990: don’t automate a bad process, first strip out what doesn’t belong in it. Research by Brynjolfsson and Hitt shows that technology mainly pays off when the organisation changes the way it works along with it.
From our blog
Short pieces from practice. They open on the blog.
The psychology behind digitalisation
You build an app or website and users leave it alone. When there's resistance, UX research won't get you further. On the person behind the user.
· 1 min read
Sources
- Ohno, T. (1988). Toyota production system: Beyond large-scale production. Cambridge, MA: Productivity Press.
- Womack, J. P., Jones, D. T., & Roos, D. (1990). The machine that changed the world. New York: Rawson Associates.
- Hammer, M. (1990). Reengineering work: Don’t automate, obliterate. Harvard Business Review, 68(4), 104–112.
- Deming, W. E. (1986). Out of the crisis. Cambridge, MA: MIT Press.
- Rother, M., & Shook, J. (1999). Learning to see: Value stream mapping to add value and eliminate muda. Brookline, MA: Lean Enterprise Institute.
- Brynjolfsson, E., & Hitt, L. M. (2000). Beyond computation: Information technology, organizational transformation and business performance. Journal of Economic Perspectives, 14(4), 23–48. doi.org/10.1257/jep.14.4.23
- Repenning, N. P., & Sterman, J. D. (2001). Nobody ever gets credit for fixing problems that never happened: Creating and sustaining process improvement. California Management Review, 43(4), 64–88. doi.org/10.2307/41166101
- Holweg, M. (2007). The genealogy of lean production. Journal of Operations Management, 25(2), 420–437. doi.org/10.1016/j.jom.2006.04.001
- Radnor, Z. J., Holweg, M., & Waring, J. (2012). Lean in healthcare: The unfilled promise? Social Science & Medicine, 74(3), 364–371. doi.org/10.1016/j.socscimed.2011.02.011